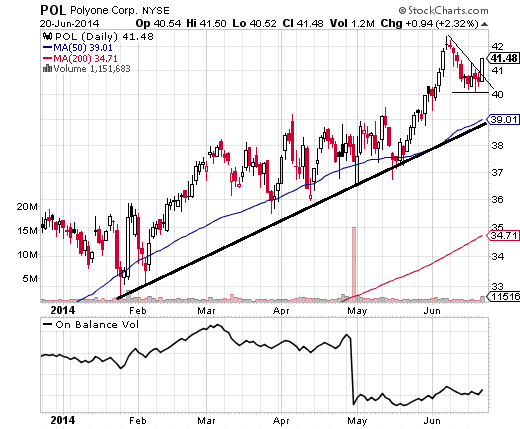
expr:class='"loading" + data:blog.mobileClass'>

nasdaq

Search in navarinoinvestment

auto slider

Τετάρτη 25 Ιουνίου 2014

Recent Flag Pattern Breakouts and four stocks


A flag is a small continuation pattern and these four stocks recently broke out of one, or are close to it. Flags provide an entry, stop and target, making them a relatively straightforward pattern to trade. The pattern is created by a strong run higher, followed by a small sideways or downward slanting consolidation, the flag. When the price breaks above the flag, initiate a long position, with a stop below the consolidation/flag. The target is traditionally based on the height of recent run higher, added to the bottom of the flag.On-balance volume can also be added to the chart to gauge the strength of trends and legitimacy of breakouts.


Hewlett-Packard Co. (HPQ)
Hewlett-Packard Co. (HPQ) popped higher on strong buying on June 13, and since then has been edging lower in a small channel or flag. A break above the flag at $35 is likely to spark further buying into the top of a trend channel at $37. The rising trend channel has been in place since December. The potential trade shouldn't last more than a couple weeks and a stop can be placed below the low of the flag, currently $34.22. On-balance volume (OBV) is steadily rising, showing continued buying interest in the stock.

SEE: Profiting In Bear And Bull Markets

Comerica Inc. (CMA)
Comerica Inc. (CMA) is also in a trend channel extending back to early 2013. The price has consolidated through most of June, but broke out on June 20. The breakout signals a likely move toward the top of the channel near $55. A stop can be placed just below the $49.59 consolidation low. On-balance volume is also increasing steadily as it pushes back toward the March highs, indicating that buyers remain keen.

PolyOne Corp. (POL)
chart
PolyOne Corp. (POL) jumped 2.32% on June 20, and closed above a small consolidation which should mark the resumption of the uptrend. $43 is one target, based on a trend channel which began in May 2013. Based on the run higher in mid-May to early June, a more aggressive target is $45. Stops go below $40.08. A massive volume day in late May has resulted in a skewed OBV. Even so, since that time the indicator has been trending higher, signaling that the uptrend is healthy and likely to continue.

Rexnord Corp. (RXN)
Finally, Rexnord Corp. (RXN) is currently in a flag formation following a strong run higher in early June. Since March, though, the stock is in a downtrend, with resistance right near the flag breakout point. If the price breaks above the flag it will spark a short-term move higher but also potentially initiate the next wave higher of the long-term trend. Target for the flag breakout is $32, with a stop below $27.91. OBV broke above its own descending trendline recently, indicating the buyers have the upper hand and an upside breakout is more likely than a downside breakout. (For related reading, see: Continuation Patterns: Rectangles and Pennants)

Δεν υπάρχουν σχόλια :

Δημοσίευση σχολίου