|
|
Coffee
As mentioned in a previous article,
coffee has been one of the greatest investments so far in 2014. As you
can see from the chart below, the iPath Dow Jones-AIG Coffee Total
Return Sub-Index (JO)
has risen an astonishing 52.67% so far this year. From a technical
perspective, notice how the recent pullback from its swing high of
$42.87 stopped near the long-term support of its 200-day moving average.
This long-term average will likely be used by many traders to help them
determine where to place their stop-loss orders so that they can
maximize the risk/reward of the trade. To help the bullish case for
coffee traders, the recent crossover shown on the MACD indicator
suggests that the next stop could be back toward the mid $40s. (For
more, check out Calculating Risk and Reward)
|
|
|
|
iPath Dow Jones-AIG Coffee Total Return Sub-Index ( JO)
|
 |
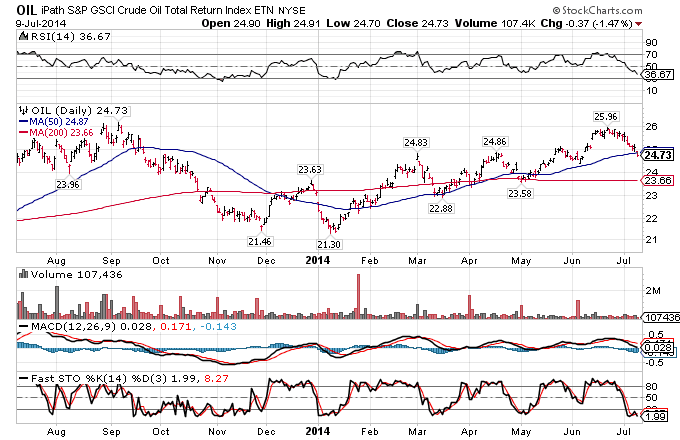
Oil
Recent articles have suggested that higher prices have recently become the reality because of conflict in the Middle East. As you can see from the chart of the iPath S&P GSCI Crude Oil Total Return Index (OIL),
the price has started to pullback from its recent high and appears to
be on route to test the support of its 200-day moving average. As was
the case for coffee traders, most oil traders will also be looking to
enter a trade as close to the 200 DMA as possible because this will
maximize the risk/reward ratio for the position. Taking a look at the
RSI and the MACD indicators would also suggest that there may be some
more short-term selling pressure before the uptrend is able to resume.
Trading signals will be generated when the two indicators create a
bottom and move above the key trigger lines. In the case of the RSI,
traders will want to see a move below 30 and then want to enter a long
position when it crosses back above. For the MACD, a buy signal will be
generated when the MACD indicator crosses above its trigger line (red
line) in the upward direction. |
|
|
iPath S&P GSCI Crude Oil Total Return Index ( OIL)
|
|
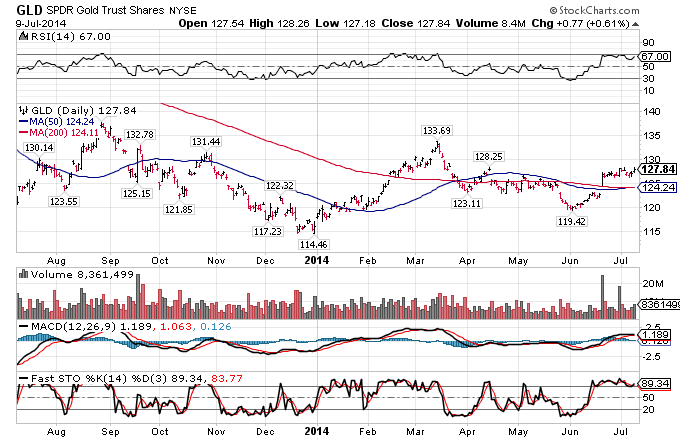
Gold
Gold has been on the rise over the past few weeks and the recent move shown in the chart of the SPDR Gold Trust ETF (GLD)
suggests that we could see a move even higher. As was the case in the
previous examples, it is interesting to see how the price action has
been respecting the support of its 200-day moving average. |
|
|
SPDR Gold Trust ETF (GLD)
|
|
| Conflict in the Middle East,
economic uncertainty and a built in inflation hedge makes GLD a very
interesting pick for any active trader. |
|
Δεν υπάρχουν σχόλια :
Δημοσίευση σχολίου